Enter your email address
Submit


![]()
![]()
![]()


 , Maryam Zarei2 , Negin Keshvari1 , Younes Mohammadi3 , Mahdi Zarei2 , Rashid Heidarimoghadam *4
Balancing the abilities-limitations of the individual and the characteristics of the work is one of the most important goals of ergonomists (1). Today, establishing anthropometric fit means, paying attention to the anthropometric characteristics of individuals and using these features while designing and making tools, equipment and workstations is common (2). But one of the most well-known differences is the physiological differences between individuals (3). Physiological balance is the balance between the physiological abilities and limitations of employees and the physiological needs of the job tasks assigned to them (4). In order to maintain the physical and mental health of employees, there must be a reasonable fit between the physiological needs of the job (such as the amount of energy required to do the job) and the physiological characteristics of the staff (such as the capacity to do physical work). Ergonomics experts believe that by measuring the characteristics of people, jobs can be assigned to them as much as they can tolerate and their health, improvement of working life, increase of work performance and organizational productivity can be guaranteed (1).
With a brief overview of the articles, a wide range of physiological examination methods in various occupations have been considered. Some have studied respiratory capacity and physical work capacity (10,11), some have focused on the study of body composition and their relationship to some physiological indicators (6) and others have only considered assessing the level of physical activity and sports of employees (12). The group of employees whose physiological studies and physiological fitness are less well studied are the employees of facilities, security, and janitorial services.
Employees of facilities, janitorial services and security guards have a variety of work tasks that put them at risk of ergonomic factors such as long working hours, environmental and psychosocial factors (stress, time pressure, job insecurity and freedom of decision), excessive force, improper posture and repetitive movements. Musculoskeletal disorders, absenteeism and job dissatisfaction are the most important consequences of exposure to ergonomic risk factors. Therefore, physiological balance is essential for the effective performance of work tasks and proper management of the consequences of ergonomic risk factors. Some researchers have considered ergonomic risk factors among these working populations (13-16), but their physiological fitness should also be examined. Therefore, the purpose of this study was to investigate the physiological characteristics of service, security and facilities employees (common jobs in any large work environment), with multifaceted physiological measurements and to examine the physiological fit of these employees with their jobs.
In this cross-sectional study conducted in 2019, 70 employees of an organization (15 in the facilities department, 38 in the janitorial service department, 17 in the law security department) after reviewing the entry / exit criteria and obtaining informed consent (Ethics Code: IR UMSHA.REC.1396.400), collaborated with researchers. Hypertension, history of cardiopulmonary disease, diabetes, musculoskeletal disorders and orthopedic limitations were the exclusion criteria.
In the first step, demographic information, anthropometric variables (with SECA scales) and parameters related to body composition (with body composition analyzer model N-20) were determined (Figure 1).
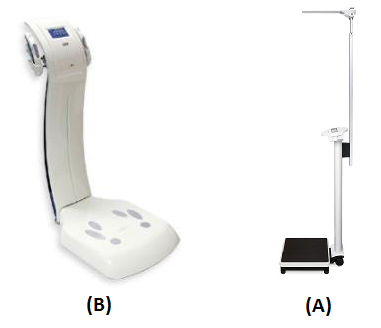
Figure 1. (A) SECA height and weight measuring instrument and (B) body composition analyzer
In the second stage, which was conducted with the aim of determining the level of physical activity (PA) of employees, the short form of the International Physical Activity Questionnaire (IPAQ) was used. IPAQ can be used for the age group of 15 to 69 years and has good validity and reliability (18-21). By determining the scores of the IPAQ questionnaire scales, the total physical activity of employees (PAtotal) was determined in terms of MET-min / week (MET1 is equal to the amount of energy consumption at rest).
In the third phase of this study, physiological indices such as VO2max, HRmax, HRstep (heart rate 15 seconds after the step test) and PWC, with adjustable step (proportional to the anthropometric dimensions of the men in the study 41 cm) and Queen's College subsurface protocol (3-minute stride with 96 beats per minute (about 24 beats per minute)) and RS800CX (Polar Electro Oy, Finland) polar heart rate monitor and related chest electrode (Figure 2). Then, using Equation 5 (resulting from McArdle pricing method) (24), the VO2max of employees was determined.
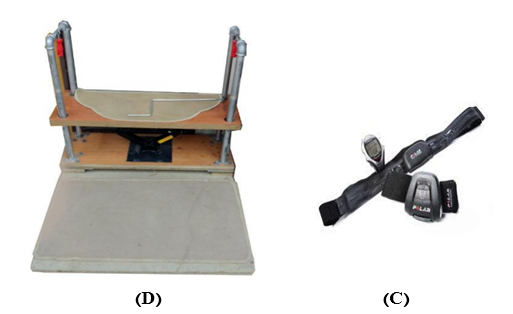
Figure 2. Queen test step (D) and polar heart rate monitor (C)
Equation 5: Determining the amount of VO2max for men based on the McArdle method
VO2max (mL / kg / min) = 111.33 - 0.42 × Heart Rate max (beat per minute)
Also, the amount of allowable working capacity, based on the equation of bank (27) (log5700-logT) × AC / 3.1 using the values of 1) maximum oxygen consumption in terms of kcal per minute (AC) and 2) working time per shifts were determined in minutes (T). Thus, the amount of work capacity allowed for janitorial service employees with 8 hours of work in one shift was about 35% of their maximum respiratory capacity. In addition, in installation and regulation jobs, 29% and 19% of maximum respiratory capacity were considered as allowable working capacity, respectively. The values reported in Table 4 are calculated based on these coefficients.
In the last step, the measurements performed were compared with standard norms (8,25,26) and the degree of compliance of individuals with their job duties was assessed.
Body Mass Index (BMI) and fat percentage (Fat%) of employees were beyond the optimal range, but Waist to Hip Ratio (WHR) were in the range. Also, the average Maximum Volume of Oxygen consumption (VO2max) were 42/1±62/33 mL/kg/min and the average of working capacity (maximum Physical Work Capacity: PWCmax) were 16/63±4/46 kcal/min (Tables 1-5).
Table 1. Description of some demographic characteristics of employees participating in the study by job
| Demographic variable | Job sections | N | M | SD |
| Age (years) | Janitorial service | 38 | 33.03 | 5.58 |
| Facilities | 15 | 33.47 | 5.45 | |
| Security | 17 | 38.41 | 7.86 | |
| Total | 70 | 34.43 | 6.586 | |
| Weight )kg( | Janitorial service | 38 | 72.28 | 15.15 |
| Facilities | 15 | 78.92 | 9.29 | |
| Security | 17 | 72.07 | 10.83 | |
| Total | 70 | 73.20 | 13.00 | |
| Height )cm( | Janitorial service | 38 | 175.42 | 6.89 |
| Facilities | 15 | 175.73 | 7.17 | |
| Security | 17 | 174.53 | 6.36 | |
| Total | 70 | 175.27 | 6.74 | |
| work experience )year/month( | Janitorial service | 38 | 9.50 | 5.92 |
| Facilities | 15 | 12.13 | 5.68 | |
| Security | 17 | 16.76 | 6.93 | |
| Total | 70 | 11.83 | 6.74 |
Table 2. Mean and standard deviation of different body compositions in employees and their significant correlation with other body compositions
| Variable | Job sections | M | SD | M | SD | Correlation with other study variables | |||
| Variable | The correlation coefficient | sig | |||||||
| BMI | Janitorial service | 23.40 | 3.68 | 23.67 | 3.41 | BMR | 0.61 | 0.001> | |
| Facilities | 24.48 | 2.56 | WHR | 0.41 | 0.001> | ||||
| Fat% | 0.34 | 0.005 | |||||||
| Weight | 0.48 | 0.001> | |||||||
| Fat mass | 0.37 | 0.200 | |||||||
| Muscle mass | 0.29 | 0.001> | |||||||
| Security | 23.53 | 3.51 | |||||||
| Basal Metabolic Rate) BMR (kcal/day or MET1 |
Janitorial service | 1649.60 | 239.95 | 1650.47 | 206.38 | Weight | 0.58 | 0.001> | |
| WHR | 0.29 | 0.018 | |||||||
| Facilities | 1676.40 | 156.96 | Muscle mass | 0.55 | 0.001> | ||||
| Security | 1630.65 | 176.76 | BMI | 0.61 | 0.001> | ||||
| Wais to Hip Right (WHR) |
Janitorial service | 0.85 | 0.73 | 0.86 | 0.07 | Fat% | 0.58 | 0.001> | |
| Facilities | 0.87 | 0.76 | BMI | 0.41 | 0.001> | ||||
| Fat mass | 0.68 | 0.001> | |||||||
| BMR | 0.29 | 0.018 | |||||||
| Security | 0.87 | 0.42 | Muscle mass | 0.55 | 0.001> | ||||
| %Fat | Janitorial service | 18.85 | 7.86 | 19.45 | 6.67 | WHR | 0.58 | 0.001> | |
| Facilities | 20.79 | 5.06 | |||||||
| Security | 19.73 | 4.56 | |||||||
| Scale | Job sections | M | SD | Total Mean | SD | Correlation with other study variables | ||
| Variable | The correlation coefficient | sig | ||||||
| Walking activities (MET-min/week) |
Janitorial service | 4991.95 | 3307.82 | 4382.22 | 3752.59 | Fat mass | -0.36 | 0.002 |
| Facilities | 4969.87 | 3895.86 | Work experience | -0.23 | 0.056 | |||
| Security | 2406.06 | 4008.90 | WHR | 0.23 | 0.058 | |||
| Moderate activity (MET-min/week) |
Janitorial service | 2035.79 | 2051.16 | 2399.42 | 2723.75 | FAT% | -0.32 | 0.007 |
| PWCmax | -0.23 | 0.059 | ||||||
| Facilities | 3152.00 | 3478.07 | VO2max | -0.23 | 0.059 | |||
| HRstep | 0.23 | 0.059 | ||||||
| Security | 2435.29 | 3255.73 | Muscle mass | 0.25 | 0.370 | |||
| Heavy activity (MET-min/week) |
Janitorial service | 1418.95 | 1858.98 | 1216.23 | 1673.73 | -- | ||
| Facilities | 1808.00 | 1562.94 | ||||||
| Security | 225.88 | 559.45 | ||||||
| Physical activity individual or total PAtotal (MET-min/week) |
Janitorial service | 8540.62 | 4775.63 | 8024.79 | 5322.21 | Fat mass | 0.29 | 0.017 |
| Facilities | 9797.80 | 5555.37 | VO2max | -0.27 | 0.025 | |||
| HRstep | 0.27 | 0.025 | ||||||
| Security | 5083.18 | 5364.27 | PWCmax | -0.27 | 0.025 | |||
| Physiological indicators | Job type | M | SD | Mean total persons | SD total | Correlation with other study variables | ||
| Variable | The correlation coefficient | sig | ||||||
| Maximum Heart Rate (HRmax) (beat / min) |
Janitorial service | 186.97 | 5.77 | 185.57 | 6.59 | Age | 1- | 0.001> |
| Facilities | 186.53 | 5.45 | ||||||
| Security | 181.59 | 7.86 | Work experience | 0.72- | 0.003 | |||
| Sub- Maximum Heart Rate after stepping test (HRstep) (beat / min) |
Janitorial service | 153.20 | 23.85 | 155.97 | 19.60 | Age | 0.35- | 0.001> |
| Fat% | 0.33 | 0.006 | ||||||
| Facilities | 158.41 | 11.57 | BMR | 0.31 | 0.010 | |||
| WHR | 0.50 | 0.001> | ||||||
| Security | 159.98 | 13.52 | Muscle mass | 0.69 | 0.001> | |||
| Maximum volume of Consumed Oxygen (VO2max) (mL/(kg/min |
Janitorial service | 32.80 | 1.62 | 33.62 | 1.42 | Fat% | 0.439 | 0.001> |
| Facilities | 32.99 | 1.25 | ||||||
| Security | 35.06 | 1.38 | ||||||
| Maximum Consumed Oxygen (VO2max) L/min |
Janitorial service | 3.40 | 1.05 | 3.33 | 0.87 | Fat% | 0.44 | 0.001> |
| Facilities | 3.54 | 0.62 | ||||||
| Security | 3.04 | 0.99 | ||||||
| Maximum Permitted Work Capacity (PWCmax) VO2max (L/min)×5 (Kcal / min) |
Janitorial service | 17 | 5.28 | 16.63 | 4.46 | (equal PWC) | ||
| Facilities | 17.72 | 3.11 | ||||||
| Security | 15.22 | 4.98 | ||||||
| Permitted Work Capacity(PWC) (Kcal / min) |
Janitorial service | 5.95 | 1.85 | 5.07 | 1.88 | BMR | 0.39 | 0.016 |
| WHR | 0.512 | 0.001 | ||||||
| Muscle mass | 0.67 | 0.001> | ||||||
| Facilities | 5.14 | 0.90 | Weight | 0.59 | 0.020 | |||
| Muscle mass | 0.75 | 0.002 | ||||||
| WHR | 0.58 | 0.029 | ||||||
| Security | 3.04 | 0.60 | Age | 0.70- | 0.002 | |||
| Fat% | 0.62 | 0.013 | ||||||
| Muscle mass | 0.77 | 0.001 | ||||||
| WHR | 0.60 | 0.014 | ||||||
| Work experience | 0.51- | 0.038 | ||||||
| Jobs | The closest job code(29) | Energy required for the job code (MET) | Mean BMR (Kcal/min) or MET1 |
Mean PWC (Kcal/min) |
Mean PWC (MET) | The difference between the required energy and the working capacity | ||
| Janitorial service | 11820 | 5.00 | 1.65 | 5.95 | 4.70 | 0.30 | ||
| Facilities | 11130 | 3.50 | 1.68 | 5.14 | 3.72 | 0.22- | ||
| Security | 11525 | 2.50 | 1.63 | 5.04 | 3.99 | -1.49 |
There was no significant difference between the study occupations in most of the body compositions. But the fat% of janitorial service employees was significantly higher than the other two job segments. The optimal range of this index based on this device is 8-19%. The American Council on Exercise (ACE) has proposed an optimal Fat% for men in the range of 14-17% (36). WHR is an indicator that is calculated by dividing the lumbar region into the pelvic environment and is a good indicator for predicting many health problems (30). According to the World Health Organization: WHO standard, a WHR rate above 0.90 among men indicates abdominal obesity and future health problems (31). The average WHR of employees (total average and by departments) was lower than the permitted rates. Fortunately, the mean BMI index among all study staff in the optimal range was 18.5-55 kg / m2 (41), but the mean of this index was significantly higher among facility staff than service and security staff. One of the most important reasons for the difference in BMI, Fat% and WHR of the staff of this study compared to other studies is the difference in the physical nature and level of physical activity of their jobs, demographic characteristics and environmental conditions.
Physical activity has a positive and significant effect on the prevention and rehabilitation of various diseases such as heart disease, hypertension, osteoporosis, cancer, respiratory diseases and diabetes (47,48). In addition, it can improve personality balance and mood, improve self-perception and mental well-being in individuals (49).
Analysis of data related to VO2max index showed that the oxygen uptake capacity of security staff was significantly lower than that of facility and janitorial service personnel. Therefore, security staff can be expected to perform strenuous physical activity with difficulty, high fatigue, and less effectiveness than facility and janitorial service personnel.
The average allowable PWC for employees was 5.76 kcal / min and there was no significant difference between employees in different job sectors. Comparison of the average PWC in each of the surveyed occupations testifies to the relative incompatibility of the occupations with the characteristics of the employees, especially in the security profession. From the point of view of physiological criteria, especially PWC, the workload of service personnel is more than their physical capacity and the workload of security staff is less than their physical capacity and abilities.
The results indicated that the level of some physical characteristics is inappropriate, physical fitness is poor and individual capabilities and job requirements are not in balance. Using standardized recruitment tests, providing the possibility of sports activities (by organizations) and finding integrated indicators that simultaneously take into account the physical, mental, social and environmental capabilities of individuals to determine work capacity (by researchers), can be facilitating steps to establish an ergonomic balance in the workplace.
The authors are grateful to all those who assisted in the writing of this article.
The authors declared no conflict of interest.
| Rights and permissions | |
 |
This work is licensed under a Creative Commons Attribution-NonCommercial 4.0 International License. |


